Mastering the Market: A Deep Dive into Candlestick Chart Patterns (PDF Guide Included)
Introduction
Ever felt like the stock market speaks a language you don’t understand? You’re not alone. But what if we told you that price charts—those squiggly lines and colorful bars—can actually tell you a story? Like learning to read someone’s expressions, candlestick chart patterns are visual cues that help traders understand the emotions behind market moves. Whether you’re just starting out or exploring trading courses, mastering these patterns is a game-changer.
In this article, we’ll break down candlestick charts using everyday language, relatable examples, and even share a free PDF guide to keep. So, grab a coffee and let’s make sense of those mysterious candlesticks together.
Explore candlestick chart patterns PDF. Find the best trading courses & trading tips in our beginner-friendly guide. Learn how charts predict price action!
What Are Candlestick Charts?
Candlestick charts are like the emojis of the trading world. Just as a smiling emoji shows happiness, a bullish candle can indicate market optimism. These charts originated in Japan centuries ago—yes, traders were using them even before modern computers!
Each candlestick represents the price movement of an asset within a specific time frame. Unlike simple line charts, candlesticks give you more information at a glance.
Why Use Candlestick Chart Patterns?
Think of candlestick patterns as signboards on a road trip. They don’t guarantee what’s ahead, but they give you a pretty good clue. Whether you’re into stocks, forex, or crypto, these patterns help predict short-term and sometimes even long-term market direction.
Key benefits:
- Visual simplicity
- Emotional insight (fear, greed, hesitation)
- Timely entry and exit signals
Anatomy of a Candlestick
Let’s break down a candlestick like a sandwich:
- Body: The meat of the sandwich. It shows the open and close prices.
- Wick (Shadow): The bread ends. They show the high and low of the session.
- Color: Green or white means price went up (bullish). Red or black means it went down (bearish).
Understanding this basic structure is crucial before jumping into patterns.
Bullish vs Bearish Candles
Bullish candles show that buyers were in control during that time frame. The closing price is higher than the opening price.
Bearish candles show the opposite. Sellers dominated, pushing the closing price below the opening.
It’s like a tug of war—whoever pulls harder wins that round.
Single Candlestick Patterns
These are patterns made up of just one candle and can be surprisingly powerful:
- Hammer: Looks like a tiny body with a long lower wick. Signals potential reversal after a downtrend.
- Doji: When open and close prices are nearly the same. Suggests indecision.
- Shooting Star: A bearish pattern that appears after an uptrend. Long upper wick, small body.
Double Candlestick Patterns
Two candles together can paint a vivid picture:
- Bullish Engulfing: A small red candle followed by a big green one. Suggests a bullish reversal.
- Bearish Engulfing: A green candle followed by a large red one. Indicates bearish momentum.
- Harami: A big candle followed by a smaller one inside its body—like a baby bump!
Triple Candlestick Patterns
Three’s a crowd? Not in this case. These patterns offer even stronger signals:
- Morning Star: A bearish candle, a doji or small candle, then a bullish candle. Great for spotting bottoms.
- Evening Star: The reverse of the Morning Star. Signals market tops.
- Three White Soldiers: Three green candles in a row. Strong bullish sign.
- Three Black Crows: Three red candles in a row. Bearish outlook.
Most Common Candlestick Patterns
Here are some must-know patterns every trader should learn:
- Marubozu: A candle with no wicks. Strong conviction in one direction.
- Spinning Top: Small body, long wicks. Indicates indecision.
- Piercing Line: Bullish pattern where a green candle follows a red one and closes more than halfway up.
These patterns pop up frequently and are a great place to start.
How to Read Candlestick Patterns Like a Pro
Reading candlestick charts isn’t just about memorizing patterns. It’s about context:
- What trend came before the pattern?
- Are other indicators confirming the signal?
- Is volume increasing?
Use candlestick patterns like you’d read a novel. Don’t just focus on one word (candle); understand the whole sentence (chart).
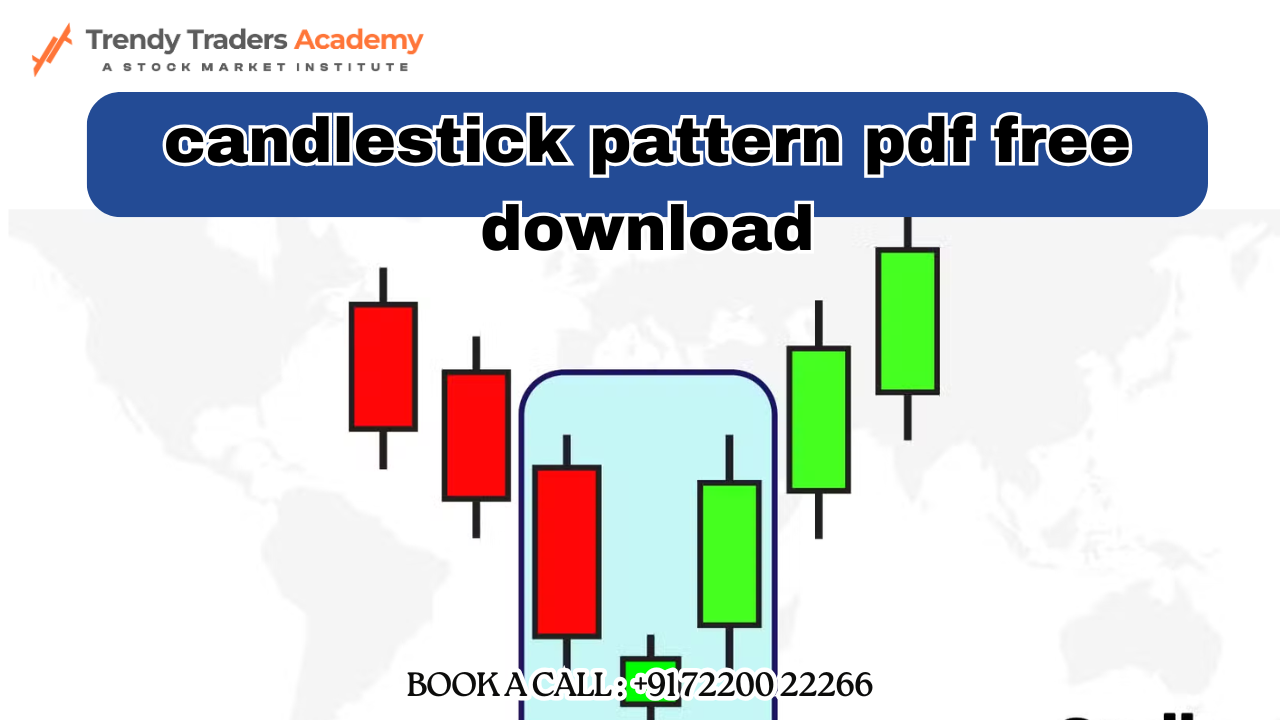
Candlestick Patterns PDF Download
We’ve put together a free candlestick chart patterns PDF you can download and print. Keep it near your trading setup like a cheat sheet.
What’s Inside the PDF:
- 20+ patterns with visuals
- Simple definitions
- When to use them
Combining Candlestick Patterns with Other Indicators
Relying on candlesticks alone is like relying on your GPS without checking traffic. Use them along with:
- Moving Averages: Smooth out trends.
- RSI (Relative Strength Index): Detect overbought or oversold conditions.
- Volume: Confirms the strength of a pattern.
Smart traders blend candlesticks with other tools for higher accuracy.
Mistakes to Avoid When Reading Candlestick Patterns
Even the best trading courses won’t help if you make these mistakes:
- Ignoring the bigger picture: Always look at the trend.
- Overtrading based on one candle: Don’t jump the gun.
- Forgetting risk management: Patterns can fail.
Learning patterns is essential, but so is discipline.
How Candlestick Patterns Help in Real-Life Trading
Imagine you’re at a poker table. Candlestick patterns are like reading your opponent’s face—no guarantees, but they give you an edge. Many successful traders rely on these visual clues to time their trades better.
Best Trading Courses to Learn Chart Patterns
If you’re serious about mastering candlestick chart patterns, enrolling in a quality trading course can speed up your learning curve. And when it comes to chart pattern expertise, one name stands out—Trendy Traders.
Why Choose Trendy Traders?
Trendy Traders is widely recognized as one of the best trading institutes in India, especially when it comes to technical analysis and price action trading. Their approach to teaching candlestick chart patterns is highly practical and easy to understand, making it perfect for beginners and intermediate traders alike.
Here’s what sets them apart:
- Expert Mentors with years of real-market experience
- Live Market Sessions to practice reading charts in real time
- Well-structured Modules focused on candlestick formations and their real-world applications
- Interactive PDF Resources for revision and hands-on learning
- Lifetime Mentorship & Support to guide your ongoing trading journey
Their students often say that after completing the course, reading a chart feels as natural as reading a book. If you’re looking for trading courses that actually work, Trendy Traders is a top pick.
Other Great Options:
- Investopedia Academy – Trusted, globally recognized resource
- Udemy’s Complete Trading Bootcamps – Affordable and beginner-friendly
- Coursera Financial Markets (Yale) – Great for academic depth and fundamentals
But if you want hands-on expertise, local market insights, and deep clarity on candlestick patterns, Trendy Traders should be your go-to learning partner.
Conclusion
Candlestick chart patterns may look complicated at first, but they’re simply visual summaries of market psychology. Once you get the hang of them, you’ll start seeing things most traders miss. Pair them with the right tools, avoid common mistakes, and consider enrolling in the best trading courses to sharpen your skills further.
Whether you’re just curious or ready to dive deep, don’t forget to grab your free candlestick chart patterns PDF—it might just become your favorite trading companion!
FAQs
What is the best candlestick pattern for beginners to learn first?
The Hammer pattern is often the easiest for beginners. It signals potential reversals and is visually simple to recognize.
Can I trade using only candlestick patterns?
Technically, yes. But combining them with other indicators increases accuracy and reduces false signals.
Where can I get a free candlestick chart patterns PDF?
You can download it from this article. Look for the PDF download section above for a handy guide.
Are candlestick patterns reliable in crypto trading too?
Absolutely! Candlestick patterns work across all markets—stocks, forex, and even crypto—because they’re based on human psychology.
What’s the best way to practice reading candlestick patterns?
Use demo accounts or backtesting platforms. Practice identifying patterns on historical charts before risking real money.